- State of the Screens
- Posts
- Upstream Effects: Streaming Surges to 25% of US Media Consumption
Upstream Effects: Streaming Surges to 25% of US Media Consumption
Streaming share of TV viewing according to Nielsen:
1) 2018-Q3 – 10%
2) 2019-Q4 – 19%
3) 2020-Q2 – 25%

Average weekly streaming minutes (YoY growth):
1) 2019-Q2 – 82
2) 2020-Q2 – 143 (↑ 74%)

Video streaming share by platform:
1) Netflix – 34%
2) YouTube – 20%
3) Hulu – 11%
4) Amazon – 8%
5) Disney+ – 4%
6) Other – 22%
Average time spent w/ video (YoY growth) according to Nielsen:
1) 2018-Q2 – 5h 57m
2) 2019-Q2 – 5h 46m (↓ 3%)
3) 2020-Q2 – 5h 56m (↑ 3%)

Average time spent w/ video by screen (% of total):
1) Live TV – 4h 16m (72%)
2) OTT/Connected TV – 1h 6m (19%)
3) Smartphone – 0h 17m (5%)
4) Desktop/Laptop – 0h 10m (3%)
5) Tablet – 0h 7m (1%)
Average time spent w/ media (YoY growth):
1) 2018-Q2 – 11h 6m
2) 2019-Q2 – 11h 27m (↑ 3%)
3) 2020-Q2 – 11h 6m (↑ 8%)

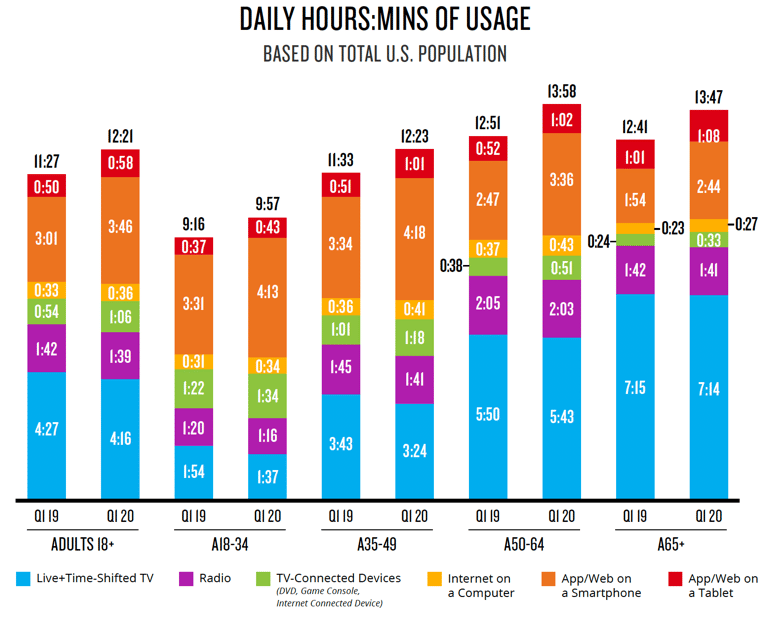
Daily hours of usage by age group:
1) 50–64 – 13h 58m
2) 65+ – 13h 47m
3) 35–49 – 12h 23m
4) 18–34 – 9h 57m
5) 18+ – 12h 21m

% change since 2010 in time spent with TV:
1) 18–24 – ↓ 69%
2) 25–34 – ↓ 68%
3) 12–17 - ↓ 64%
4) 2–11 - ↓ 53%
5) 35–49 – ↓ 35%
6) 2+ – ↓ 27%
7) 50–64 - ↓ 10%
8) 65+ – ↑ 3%

The post Upstream Effects: Streaming Surges to 25% of US Media Consumption appeared first on Cross Screen Media.
Reply