- State of the Screens
- Posts
- TV Turmoil: Networks Work To Adapt To New Normal
TV Turmoil: Networks Work To Adapt To New Normal
Michael Beach
August 26, 2020
Big question: Are better days ahead for Madison Avenue?
Quick answer: Unclear. The advertising industry was already facing headwinds (changing consumer behavior, trust, etc.), exasperated by COVID-19.
National broadcast and cable TV ad revenue (YoY change) according to Variety:
1) 2018-Q2 – $11.5B
2) 2019-Q2 – $11.7B (↑ 2%)
3) 2020-Q2 – $8.6B (↓ 27%)

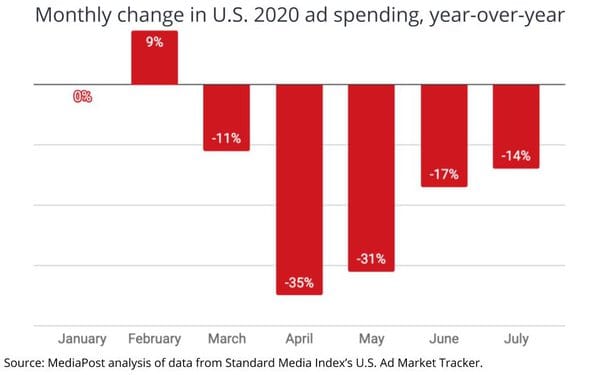
YoY change in monthly U.S. ad spend according to Standard Media Index:
1) Jan-20 – ↑ 2%
2) Feb-20 – ↑ 9%
3) Mar-20 – ↓ 11%
4) Apr-20 – ↓ 35%
5) May-20 – ↓ 31%
6) Jun-20 – ↓ 17%
7) Jul-20 – ↓ 14%
Quote from Shari Cohen – Former Senior Buying Executive @ GroupM:
“It is really hard to be a sales organization and go in every Monday and have all of this inventory to sell and not know where the demand is coming from each week”
Top 3 industries based on difference in TV ad spend according to iSpot:
1) Politics – ↑ $517M
2) Home & Real Estate – ↑ $336M
3) Health & Beauty – ↑ $129M
Bottom 3 industries based on difference in TV ad spend:
1) Automotive – ↓ $1.2B
2) Electronics – ↓ $720M
3) Travel – ↓ $711M

The post TV Turmoil: Networks Work To Adapt To New Normal appeared first on Cross Screen Media.
Reply