- State of the Screens
- Posts
- Nielsen Total Audience Report for 2018-Q1
Nielsen Total Audience Report for 2018-Q1
Michael Beach
August 07, 2018
Average time spent w/ media in Q1:
1) 2018–11h 6m (↑ 3%)
2) 2017–10h 47m
3) 2016–10h 30m
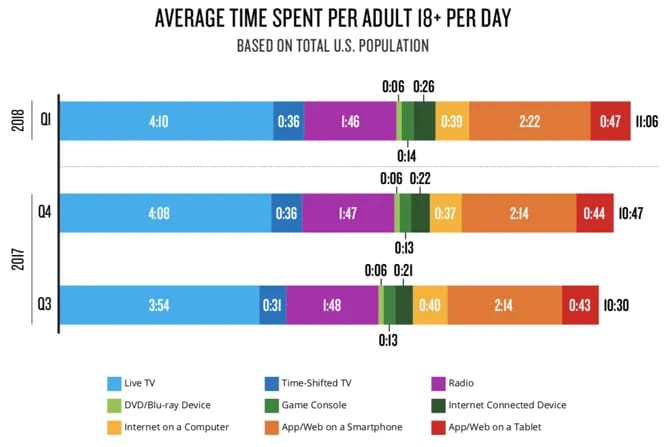
Average time spent w/ video:
1) 2018-Q1–5h 57m
2) 2017-Q4–5h 46m
3) 2017-Q3–5h 27m

Average time spent w/ video by screen (% of total):
1) Live TV — 4h 46m (80%)
2) OTT/Connected TV — 0h 46m (13%)
3) Desktop/Laptop — 0h 10m (3%)
4) Smartphone — 0h 10m (3%)
5) Tablet — 0h 5m (1%)
Time spent by screen in Q1 (2017 vs. 2018):
1) Live TV — 4h 10m (↓ 4%)
2) Mobile — 2h 22m (↑ 2%)

Daily hours of usage by age group:
1) 18–34–8h 45m
2) 35–49–11h 9m
3) 50–64–12h 50m
4) 65+ — 12h 16m
5) 18+ — 11h 6m
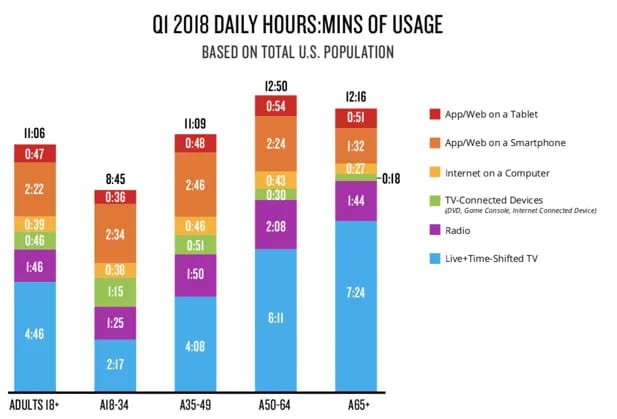
Share of media consumption from live TV:
1) 18–34–26%
2) 35–49–37%
3) 50–64–48%
4) 65+ — 60%
5) 18+ — 43%
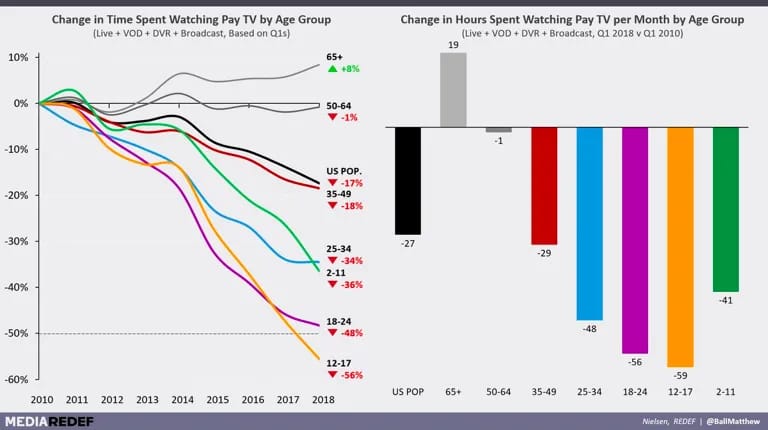
% change since 2010 in time spent with TV (h/t: @ballmatthew):
1) 12–17 — ↓ 56%
2) 18–24 — ↓ 48%
3) 2–11 — ↓ 36%
4) 25–34 — ↓ 34%
5) 35–49 — ↓ 18%
6) 2+ — ↓ 17%
7) 50–64 — ↓ 1%
8) 65+ — ↑ 8%
More than 2/3 of TV households are able to stream video to a TV.
The post Nielsen Total Audience Report for 2018-Q1 appeared first on Cross Screen Media.
Reply