- State of the Screens
- Posts
- Netflix Holds A (Shrinking) Lead In Streaming
Netflix Holds A (Shrinking) Lead In Streaming
Michael Beach
October 15, 2020
CTV/OTT time spent by network type according to Comscore:
1) Netflix – 26%
2) YouTube – 21%
3) Amazon Prime – 17%
4) Hulu – 14%
5) Disney+ – 5%
6) Other – 17%

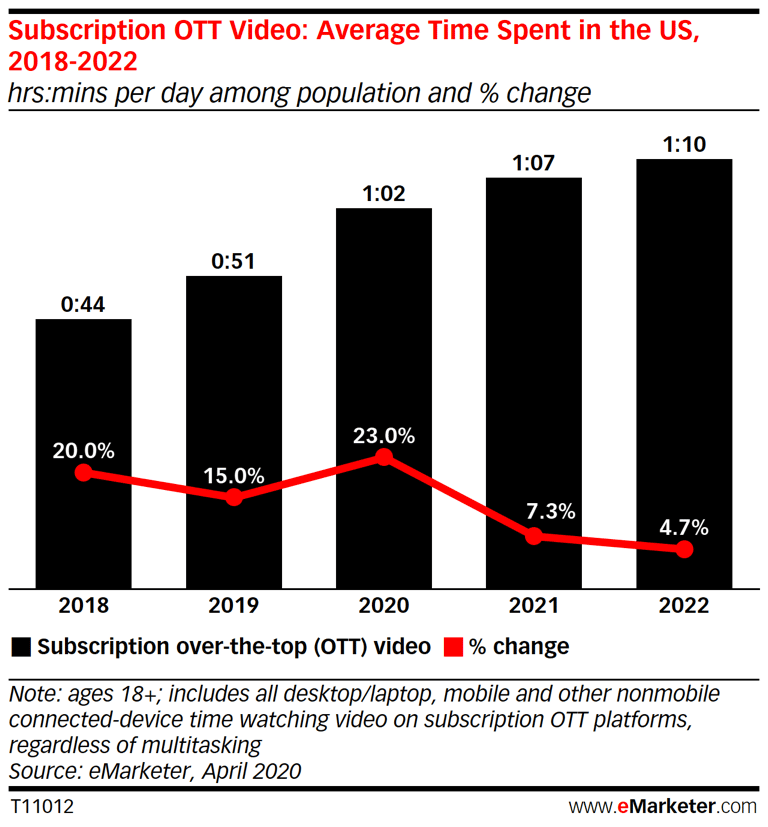
Time spent with SVOD services according to eMarketer:
1) 2018 – 0h 44m (↑ 20%)
2) 2019 – 0h 51m (↑ 15%)
3) 2020P – 1h 2m (↑ 23%)
4) 2021P – 1h 7m (↑ 7%)
5) 2022P – 1h 10m (↑ 5%)
Share of streaming time w/ SVOD according to Reelgood:
1) 2020-Q2 – 52%
2) 2020-Q3 – 48%

Interesting: The overlap between various streaming services.

Top streaming programs by total minutes during early September according to Nielsen:
1) Cobra Kai (Netflix) – 1.7B
2) Away (2020) (Netflix) – 1.4B
3) Lucifer (Netflix) – 1.1B
4) The Boys (Amazon) – 1.1B
5) The Office (Netflix) – 947M
6) Criminal Minds (Netflix) – 783M
7) Greys Anatomy (Netflix) – 705M
8) NCIS (Netflix) – 587M
9) Shameless (Netflix) – 556M
10) Sister, Sister (Netflix) – 432M

The post Netflix Holds A (Shrinking) Lead In Streaming appeared first on Cross Screen Media.
Reply