- State of the Screens
- Posts
- Extreme Reach: 2019-Q2 Video Benchmarks
Extreme Reach: 2019-Q2 Video Benchmarks
Michael Beach
October 10, 2019
Share of impressions by length in 2019-Q2 according to Extreme Reach:
1) 30s – 64%
2) 15s – 33%
3) 60s – 2%
4) 6s – 1%

Share of impressions for 6s:
1) 2017-Q1 – 0.04%
2) 2017-Q2 – 2%
3) 2017-Q3 – 3%
4) 2017-Q4 – 5%
5) 2018-Q1 – 3%
6) 2018-Q2 – 1%
7) 2018-Q3 – 2%
8) 2018-Q4 – 1%
9) 2019-Q1 – <1%
10) 2019-Q1 – 1%
Share of impressions by device (share change):
1) Connected TV – 50% (↑ 12%)
2) Mobile – 25% (↓ 5%)
3) Desktop - 16% (↓ 7%)
4) Tablet – 6% (↓ 3%)
5) Other – 3% (↑ 3%)

Completion rate by device:
1) Connected TV – 95%
2) Tablet – 87%
3) Desktop – 83%
4) Mobile – 81%

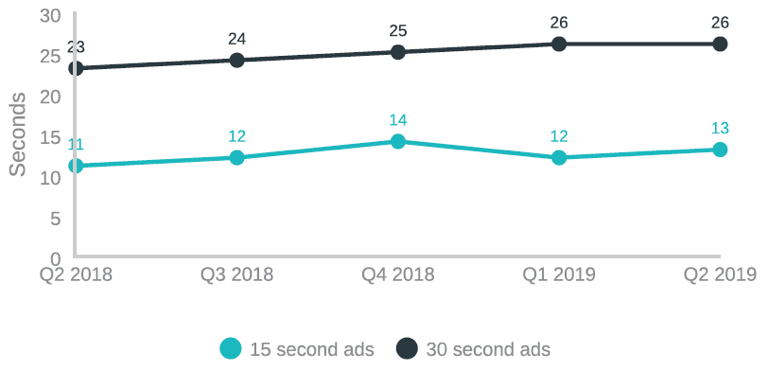
Average view time by length:
1) 30s – 26s (87%)
2) 15s – 13s (87%)
The post Extreme Reach: 2019-Q2 Video Benchmarks appeared first on Cross Screen Media.
Reply